What is an area-based approach in forest inventory?
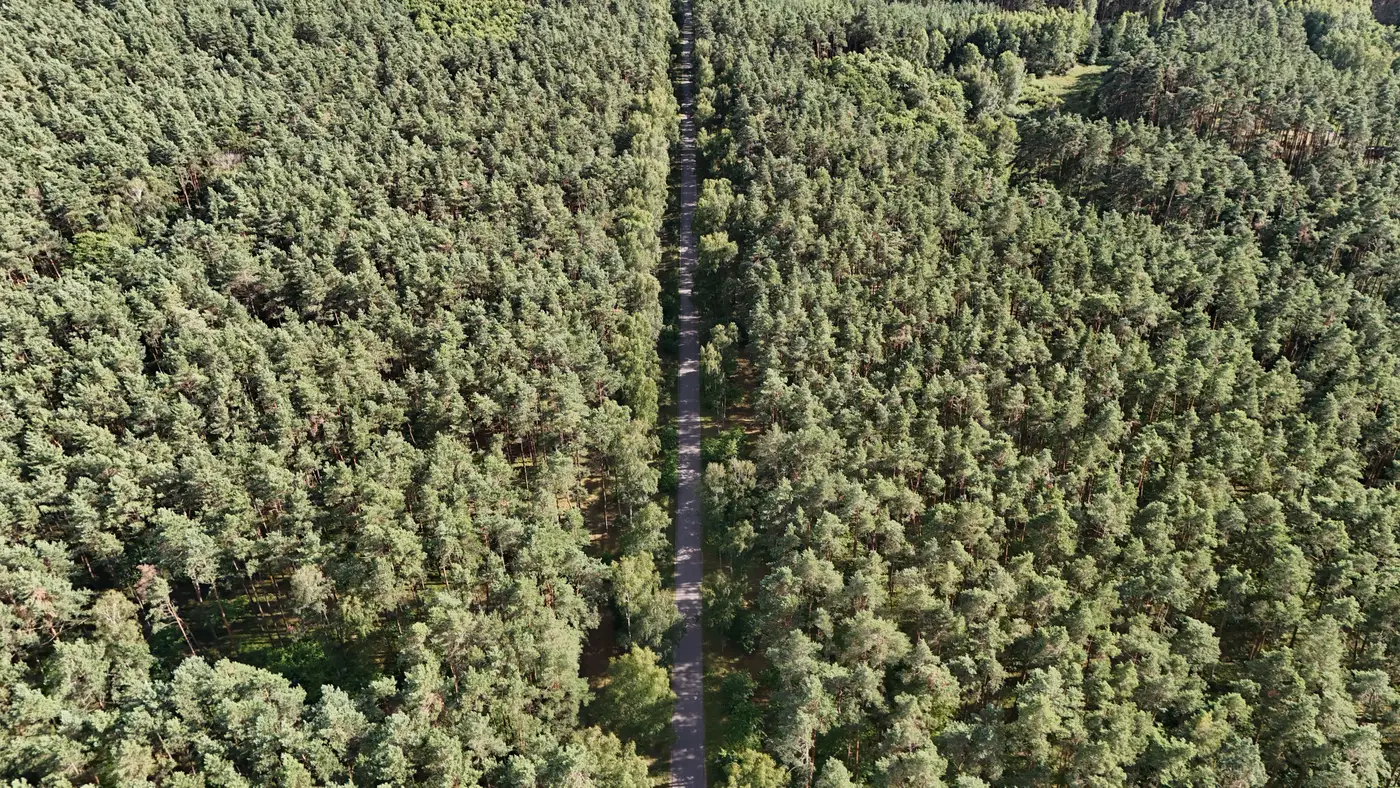
If you've spent any time around LiDAR-based cruising or heard a forester mention "ABA," you've run into the term without necessarily getting a clean definition. An area-based approach treats the forest as a grid of cells, usually somewhere between 10 and 30 meters on a side, and summarizes the height and density of everything inside each cell into a handful of statistics: mean height, height percentiles (the 95th is a common one), canopy cover, maybe a few texture metrics. Those cell-level statistics get regressed against field plot data, mostly basal area, volume, and biomass measured on the ground, and the resulting model gets applied back across the whole grid. The output is a wall-to-wall volume or biomass surface built from a relatively small number of plots.
This is the method most commercial forest inventory work has run on for close to two decades now, going back to the early LiDAR strip-sampling programs in the Pacific Northwest and Scandinavia. It's not new. What's changed is the input data.
How an area-based inventory gets built
The workflow has three pieces. First, a remotely sensed height surface, historically airborne LiDAR, increasingly a photogrammetric canopy height model built from overlapping stereo imagery. Second, a set of field plots scattered across the strata you care about (age class, species group, site index) with cruised volume or basal area. Third, a regression or machine-learning model that links the two: cell statistics in, plot-measured volume out.
The plot count matters more than people expect going in. You don't need a plot in every cell, that's the entire point of the approach, but you need enough plots per stratum to pin down a believable relationship between canopy structure and standing volume. A stand with thin, spotty plot coverage will still get a volume number out of an ABA model. Whether that number holds up is a separate question, and it's the one most timber cruise audits actually turn on.
Area-based approach vs individual tree detection
The alternative method, individual tree detection (ITD), tries to find and measure each tree crown separately: locate local maxima in the height surface, delineate a crown boundary around each one, estimate height and diameter per tree, then sum up to get stand-level volume.
ITD sounds more rigorous because it's counting trees instead of averaging cells, and in open, well-spaced stands (mature pine plantations, orchard-like spacing) it can work well. But it falls apart fast in anything with a closed, overlapping canopy, which describes most managed timberland and most tropical or temperate carbon project forests. Overlapping crowns get missed, merged, or split, and the per-tree errors compound into a stand-level volume estimate that's often worse than what ABA gets from the same imagery. ABA doesn't care whether it can see individual crowns. It's reading the aggregate structure of the canopy surface, which is a more forgiving signal in dense, multi-layered stands.
That's the practical reason ABA has become the default for commercial and carbon-grade inventory, and ITD stays a niche tool for low-density, high-value stem counts where per-tree detail earns its keep.
Where this fits into a holding or project cycle
For a REIT asset manager, an ABA layer refreshed on an annual cycle gives you a standing-volume figure that tracks growth and harvest activity between full ground cruises, useful for valuation updates and loan covenant reporting without re-flying field crews every year. For a carbon project developer, the same layer supports biomass reporting across a project area where ground plots alone would be too sparse or too expensive to carry the whole claim.
The input imagery is the part that's shifted the most. Airborne LiDAR still produces the cleanest height surface, but it's expensive to fly annually and most programs don't. A canopy height model built from overlapping very-high-resolution stereo passes gets you most of the same structural signal, ABA-ready, without putting a LiDAR sensor in the air every cycle.
If an annual volume layer built this way would slot into your reporting calendar, Canopy Height Mapping is worth a look.