Site index curves, explained for timberland valuation
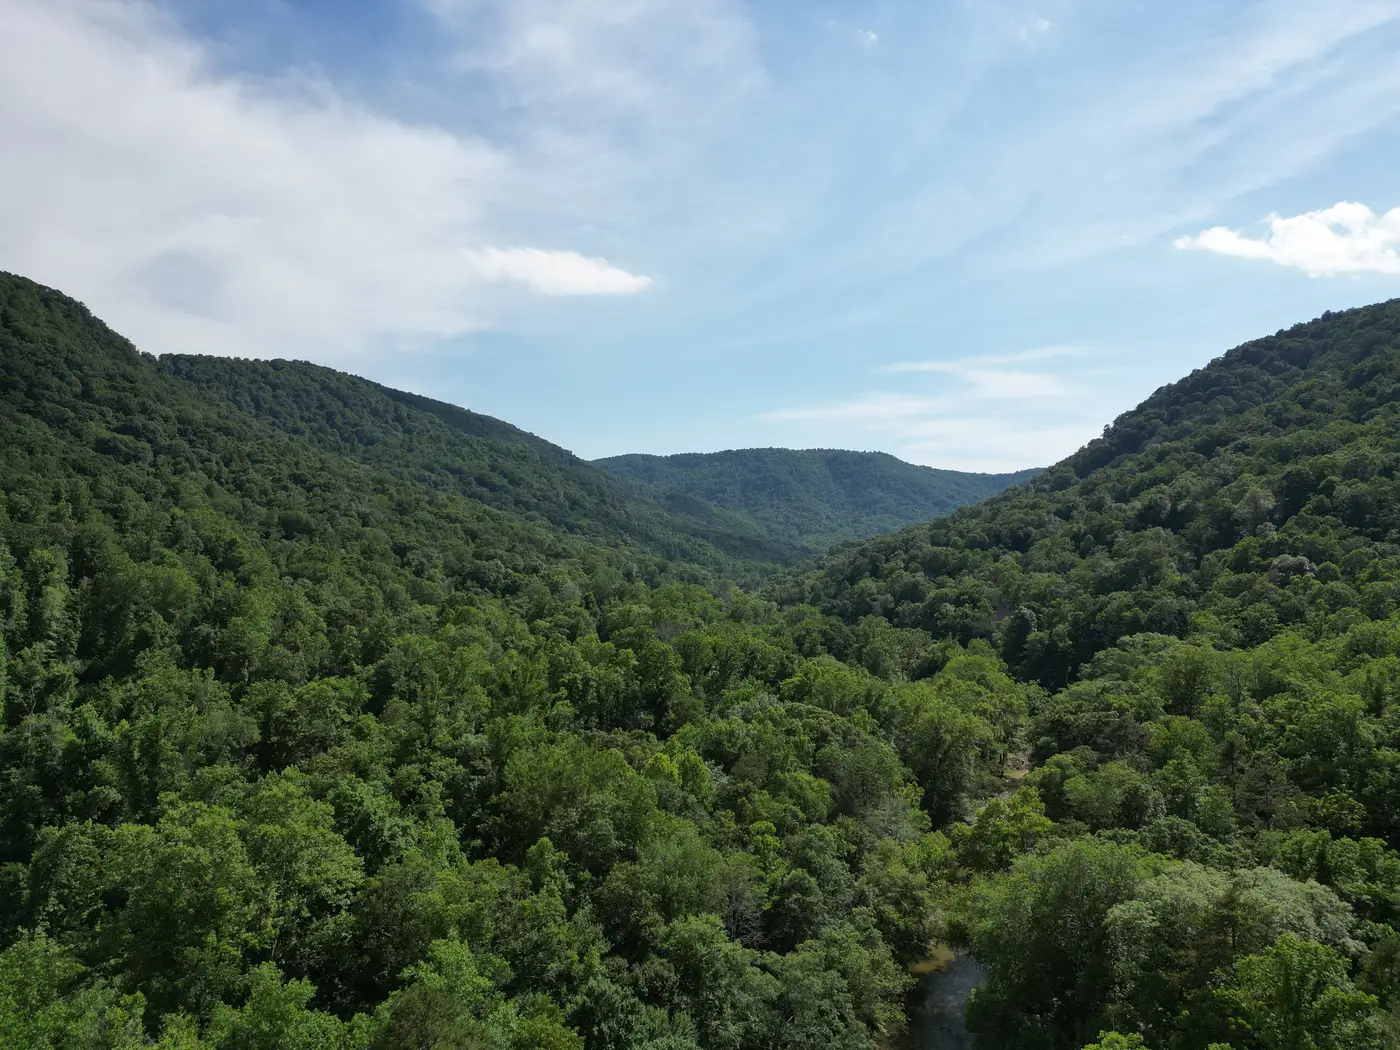
A site index number shows up on nearly every timber cruise report and appraisal summary, usually as a single figure next to a stand's species and age. It looks simple. It isn't always used correctly, and for a REIT asset manager pricing a holding or a carbon developer scoping a project area, mixing up what site index tells you versus what it doesn't can skew a valuation more than people expect.
What a site index curve actually measures
Site index measures land productivity: the capacity of a given acre to grow trees, independent of how much timber happens to be standing on it today. A forester picks a base age, commonly 25 or 50 years depending on species and region, then plots the expected height of dominant and co-dominant trees at that age for a given site quality. The curve itself is a family of height-over-age lines, each one representing a different productivity class. Drop a stand's current height and age onto the chart, trace back to base age, and you get a site index value, say SI 70 at base age 25 for loblolly pine.
That number is a proxy for how fast trees grow on that ground: soil depth, drainage, aspect, rainfall, all baked into one figure. Two stands planted the same year, same species, same stocking, can carry very different site index values if one sits on a well-drained ridge and the other on a wet flat. The curve lets you compare across stands and across ownership without walking every acre with a soil auger.
Site class and what it changes in an appraisal
Site index rolls up into site class, a coarser bucket (Excellent, Good, Fair, Poor, or a numbered scheme depending on the region and the yield tables in use). Appraisers lean on site class for a few things:
- Setting growth projections for a discounted cash flow model, since a higher site index means faster volume accrual between now and the next cruise or rotation
- Picking the right yield table or growth-and-yield model for a stand instead of applying a regional average
- Flagging land that's underperforming its soil type, which can point to drainage problems, past fire, or a stand that was planted on the wrong rotation length for its ground
A buyer evaluating a cruise report should read site index as a forward-looking growth potential figure, a statement about future capacity. What's merchantable right now is a separate question, answered by the cruise volume itself, not by the index. A SI 80 stand that was just thinned hard has plenty of upside and very little standing volume this year. A SI 60 stand at rotation age might be fully stocked and ready to cut. Same productivity ranking, opposite near-term value.
Where the curve runs out of answers
Site index comes from a sample, not a census. A cruiser measures a handful of dominant trees per plot and extrapolates; the resulting curve describes potential growth across the stand, a statistical read standing in for the actual volume on every acre of a 4,000-acre tract. It also assumes a growth-and-yield model fit to regional data, which drifts further from reality the longer it's been since the last full cruise and the more the stand has been through weather events, beetle pressure, or partial harvests that weren't logged cleanly.
For a holding being valued this quarter, or a carbon project area that needs a defensible standing-volume baseline for the reporting cycle, site index answers how productive the ground is. It doesn't tell you what's standing on it today. Those are different questions, and a transaction or a carbon registry filing usually needs both.
That's the gap a canopy surface model built from overlapping stereo imagery is meant to close: a height and standing-volume read across the whole parcel, refreshed on an annual cadence, that sits alongside the site index work instead of replacing it. If you're trying to pair site productivity numbers with an actual volume layer for a holding or project area, see how Canopy Height Mapping builds that layer from stereo passes without a ground LiDAR campaign.