How to detect harvest removals between annual canopy height passes
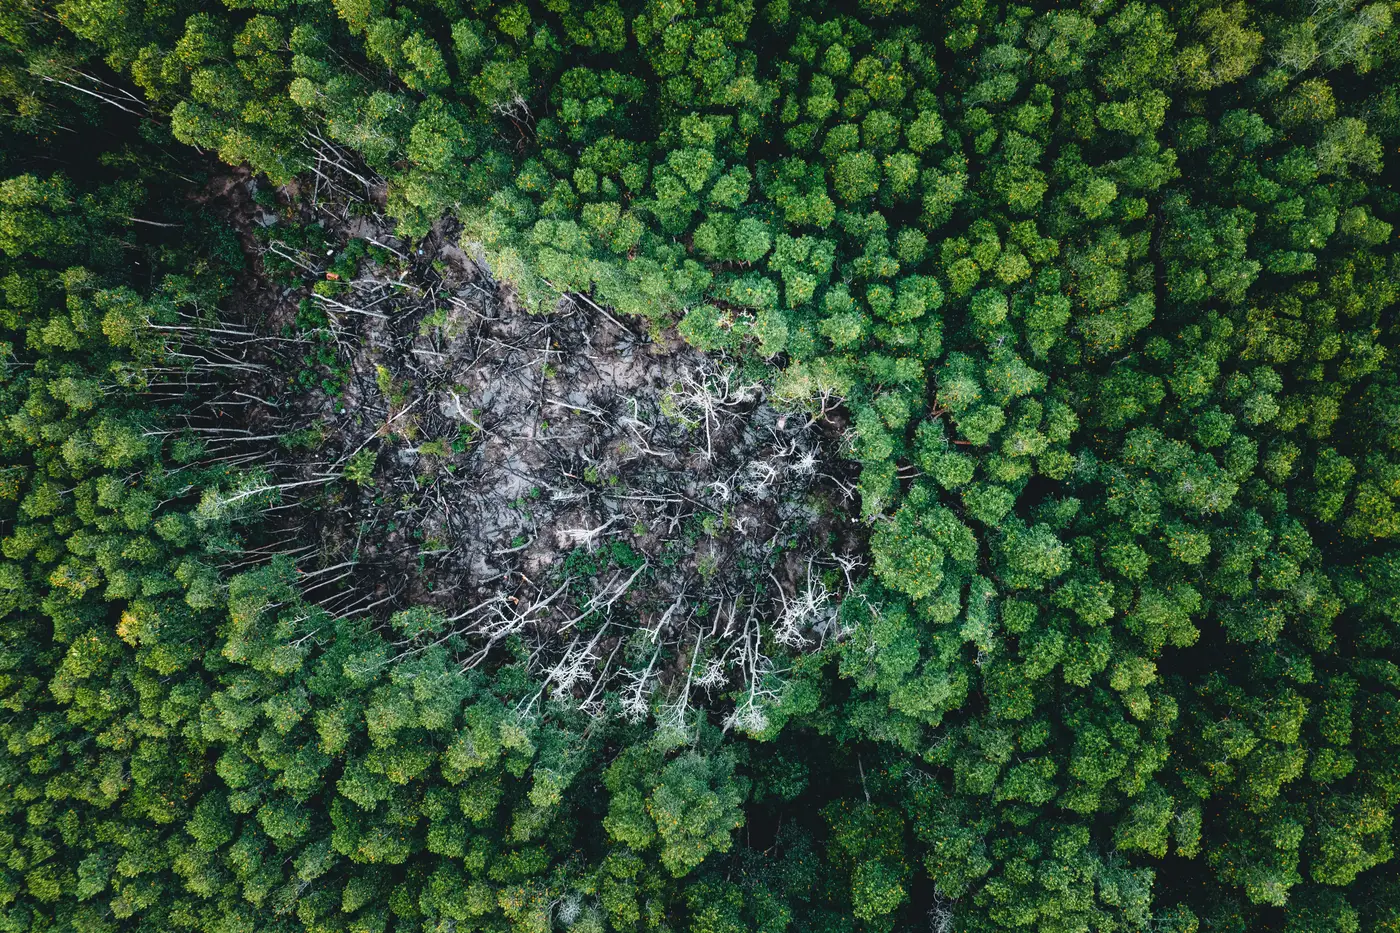
A cruise cycle tells you what a stand looked like five or ten years ago. A canopy height model, run annually, tells you what it looks like right now. The gap between those two timelines is exactly where unauthorized harvest hides, and it's also where a surprising amount of legitimate operational confusion lives, too: a thinning the field crew forgot to log, a salvage sale that went in without an updated GIS layer, a neighbor's skidder trail that clipped three acres of your boundary stand.
Detecting removals between passes isn't complicated in principle. You difference two height rasters, flag the pixels that dropped, and check those flags against what your cut schedule says should have happened. The work is in getting that comparison clean enough to trust.
Differencing two canopy surfaces
Each annual pass produces a canopy surface model built from overlapping stereo imagery, basically an elevation map of the tops of trees rather than the ground. Subtract this year's surface from last year's, stand by stand, and anywhere the height dropped by more than a few meters across a contiguous patch is a candidate removal. A single tree falling in a windstorm shows up as a small, irregular hole. A harvest shows up as a geometric patch with a hard edge, usually following a property line, a road, or a compartment boundary.
That shape difference matters more than people expect. Blowdown and bark-beetle mortality spread along slope and aspect, following terrain rather than any cadastral line. If your flagged polygon lines up neatly with a parcel boundary that isn't on this year's harvest plan, that's the one to drive out and check, not the ragged patch in the middle of a stand that's been showing stress for two passes running.
Cross-reference the flagged area against your compartment records before you dispatch anyone. A removal that matches an approved cut block and a logged stumpage ticket is just confirmation your records are current. A removal with no matching paperwork, inside your boundary, is the one worth a site visit and, depending on what you find, a call to your attorney.
Annual refresh versus the cruise cycle
Most timberland holdings run a cruise on a five-, seven-, or ten-year rotation, stand by stand, because a full ground cruise is expensive and labor-intensive to run every year. That cadence works fine for growth-and-yield modeling on a normal rotation. It's a poor fit for catching something that happened eighteen months after your last cruise crew walked off the property.
An annual canopy height pass doesn't replace the cruise. It fills the gap between cruises with a standing-volume check you can run every year without putting a crew in the field, which means the first sign of an unauthorized removal is a flag on this year's imagery instead of a surprise during next cycle's cruise, by which point the wood is gone, the trail is cold, and the only evidence is a volume number that doesn't reconcile. For a carbon project area in particular, where your reported sequestration depends on the stand still standing, finding out at the next scheduled cruise is too late. The reporting period has already closed.
The practical workflow most asset managers land on: run the annual pass across the full holding or project area, let the differencing flag anything outside expected bounds, triage those flags against the harvest schedule, and only send a crew to the ones that don't reconcile. That turns a ground check from "walk every boundary every year" into "walk the handful of parcels the imagery actually disagrees with you about."
Canopy Height Mapping builds that annual surface model and the standing-volume layer behind it from overlapping VHR stereo passes, so a holding gets a volume read every year without a ground LiDAR campaign to fund first. If you're trying to close the gap between cruise cycles on a holding or carbon project area, see how the annual volume layer works.